Help & Information (Small molecule)
How to Use
Welcome to the PreStaphy (Small molecule) tool, follow these steps to analyze your chemical molecules:
- Select Model: Choose from the available models in the dropdown menu. Select "Model all" to get predictions from all available models simultaneously.
- Default Threshold: The default threshold for the selected model is displayed. Adjust this value using the slider to modify prediction sensitivity.
- Select File: Drag and drop a CSV or TXT file, or click "Select File" to select. Ensure the file contains a column with "smiles" or "SMILES" in the header. Maximum 200 sequences allowed. If you need to predict more quantities, contact us. Please note that everything is free.
- Enter SMILES: Paste SMILES strings directly into the text box, one per line. Maximum 200 sequences allowed.
- Start Prediction: Click the "Start Prediction" button to begin analysis. A progress bar will indicate the status of your request.
- View Results: The results will be displayed in an interactive table. Click on the column header to sort the results.
- Download Results: Click "Download Results" to export the results table as a CSV file for further analysis.
- ☆Evaluate Your Results: Category 1 and Category 2 are the prediction conclusions you obtained, with thresholds of 0.74 (strict threshold) and 0.7 (loose threshold), respectively. If your SMILES are both positive in Category 1 and Category 2, congratulations, your molecule may be active against S. aureus or MRSA. Of course, you can also sort based on the threshold of a single model: Model1~0.74, Model3~0.74, Model7~0.75, Model10~0.75. In short, the higher the score of your molecule, the more likely it is to be active. As PreStaphy has not yet been published, all results are for reference only.
Model Metrics
Our prediction models have been rigorously evaluated using industry-standard metrics to ensure reliability and accuracy.
Accuracy
The proportion of correctly predicted positive and negative compounds across all test cases.
AUC-ROC
The Area Under the Receiver Operating Characteristic curve, measuring the model's ability to distinguish between classes.
F1-score
The harmonic mean of precision and recall, providing a balance between the two metrics.
Performance Visualizations
Detailed performance metrics for each model, including ROC curves and confusion matrices.
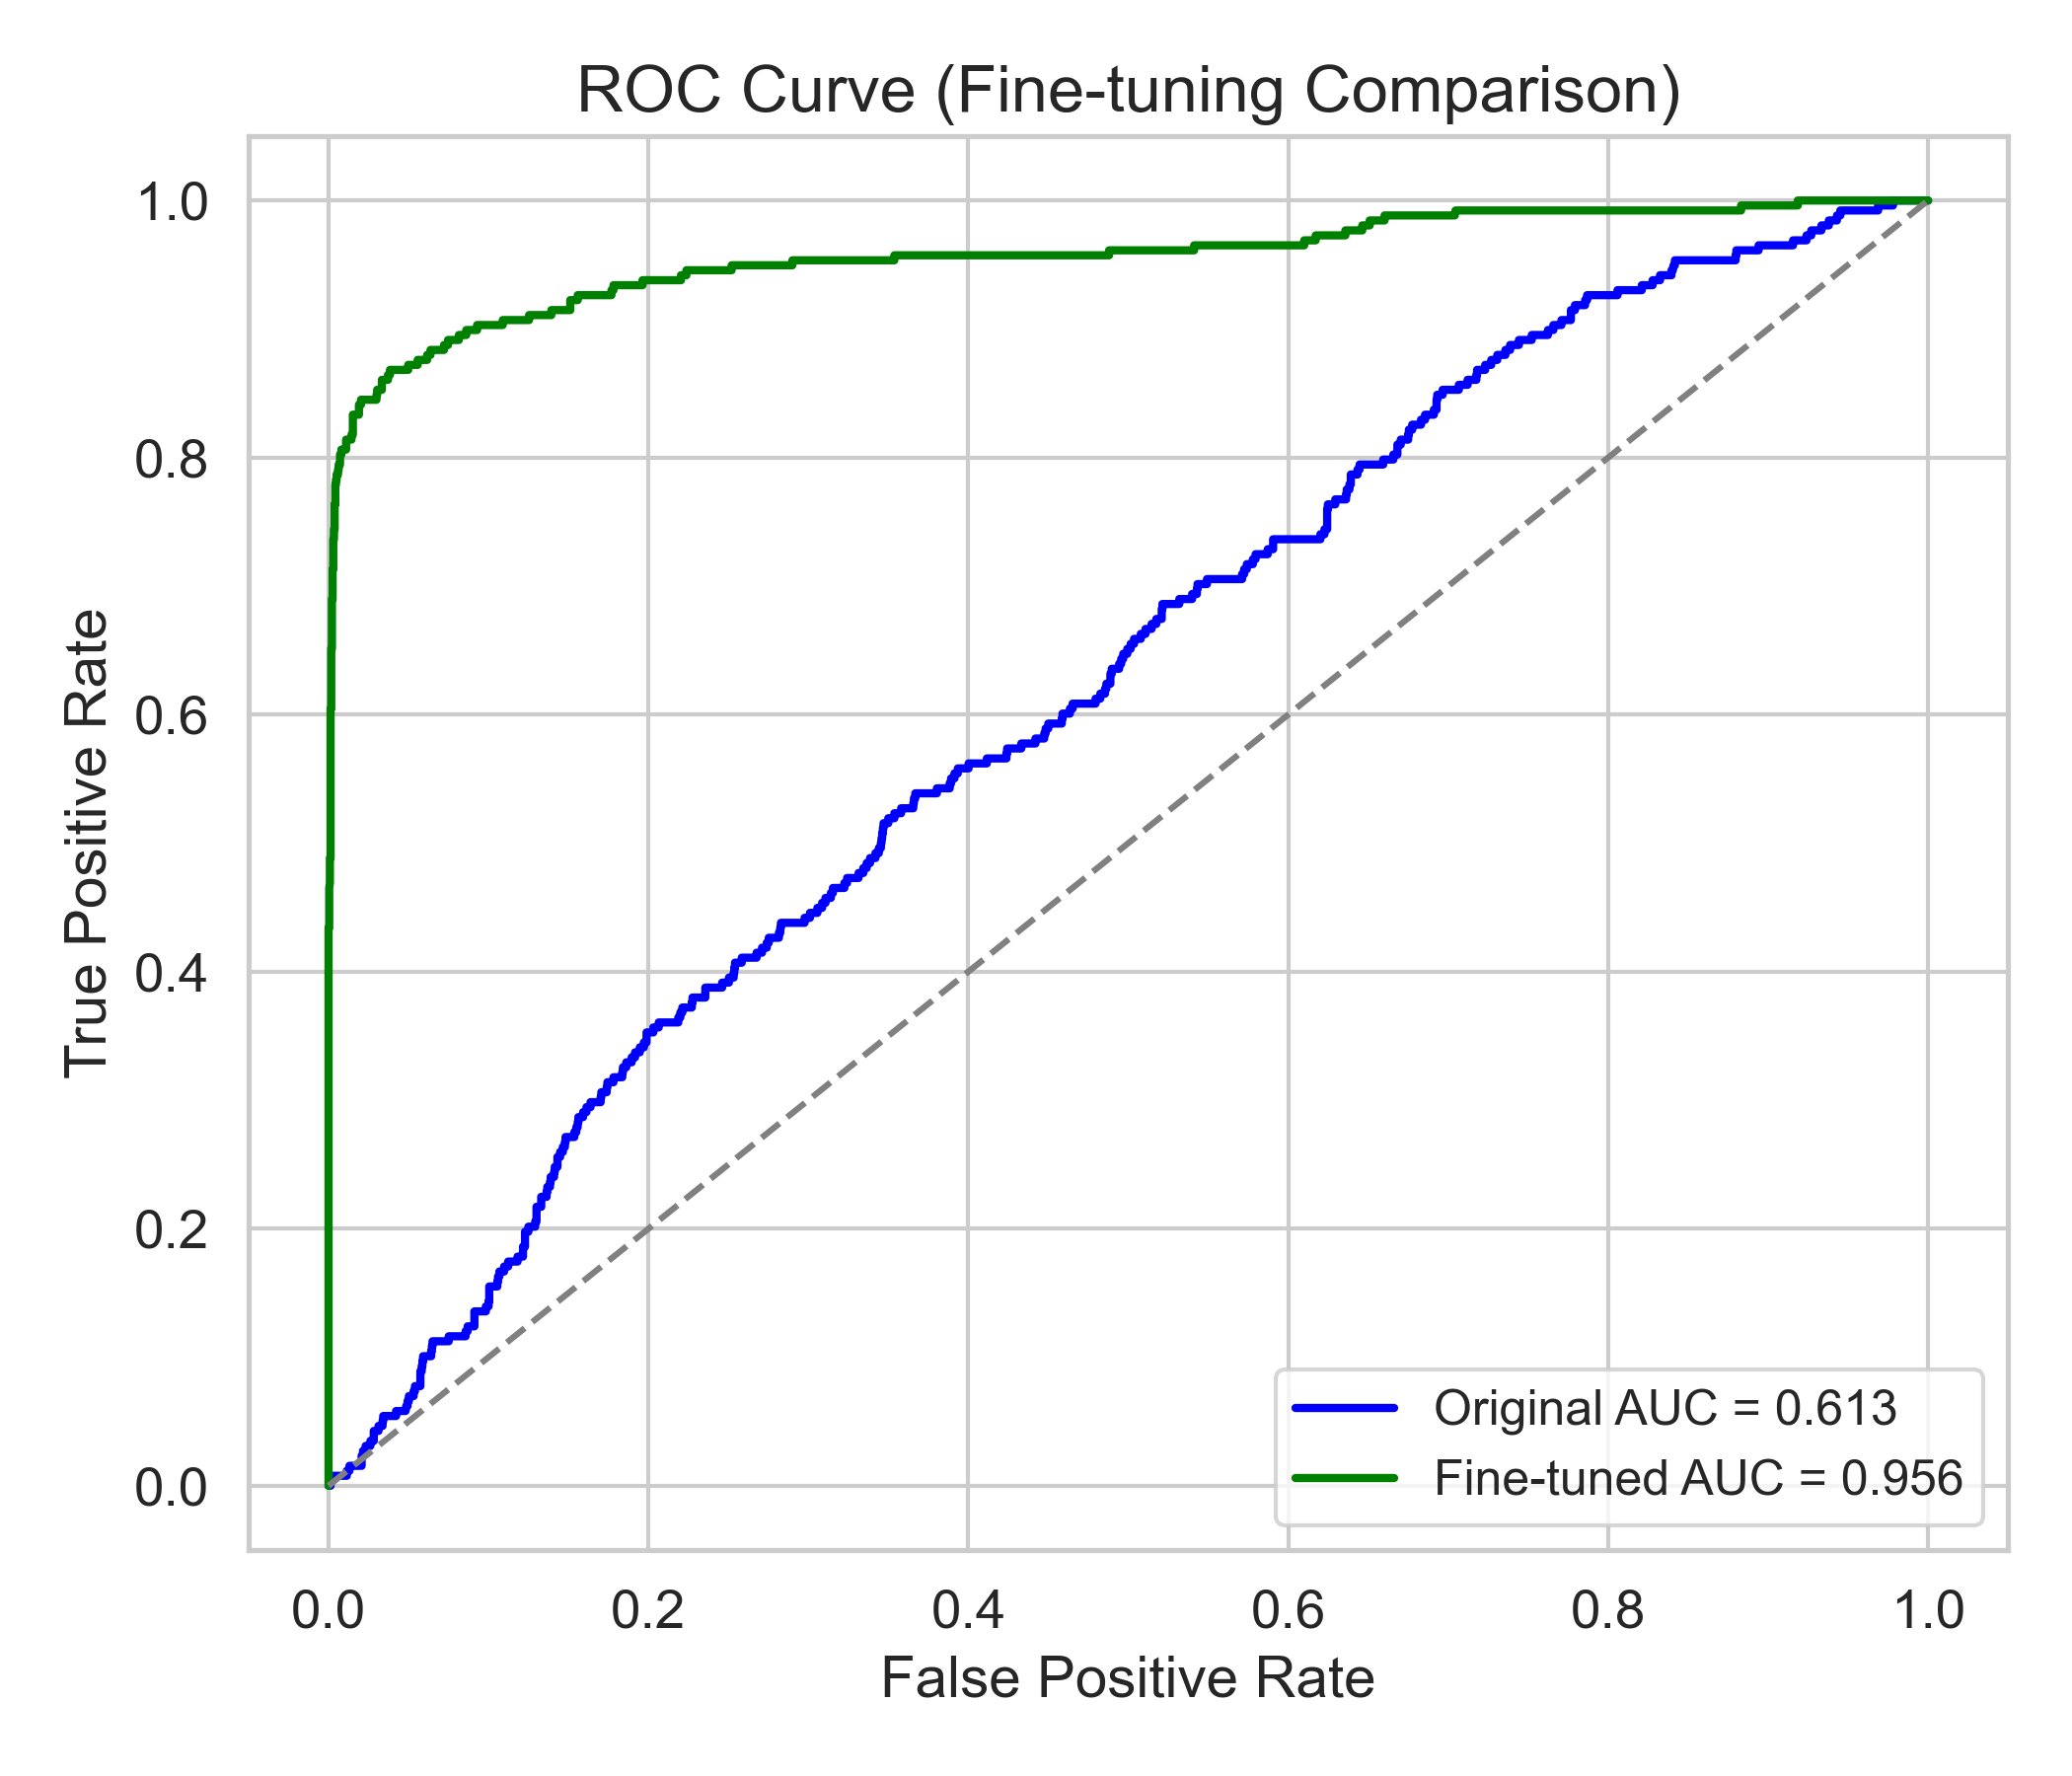
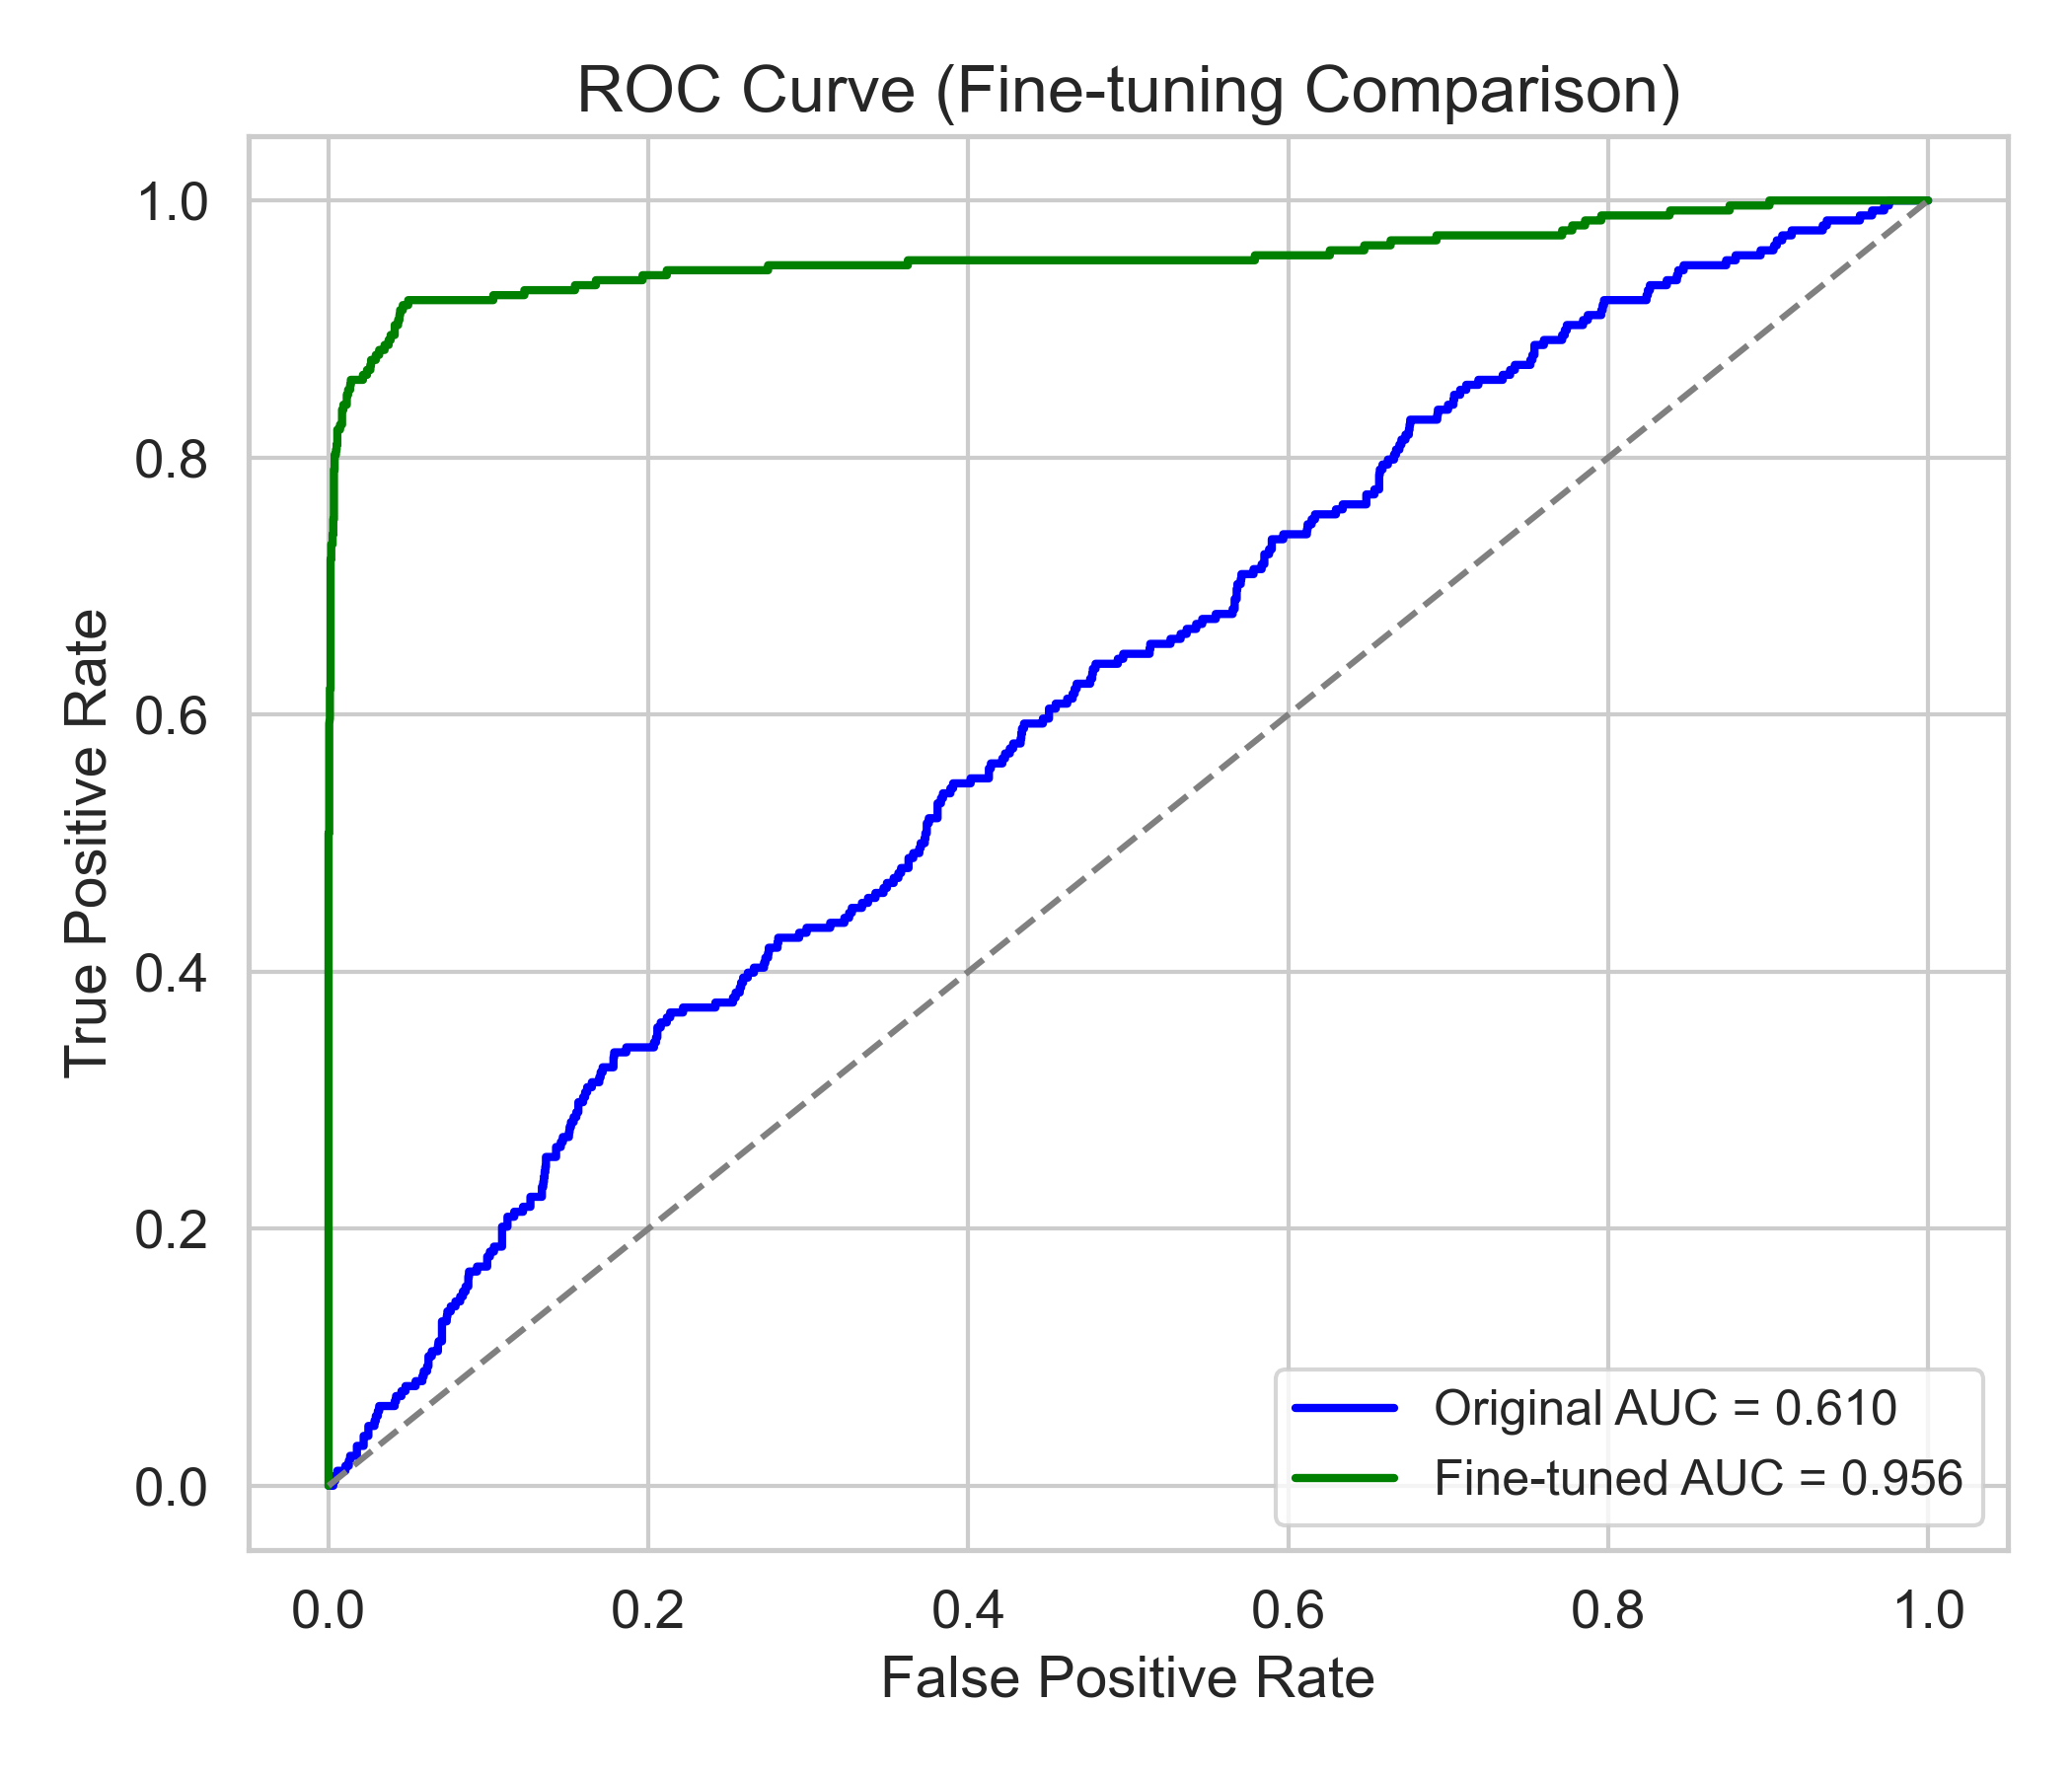
Model 1 - ROC Curve
Receiver Operating Characteristic curve showing true positive rate against false positive rate
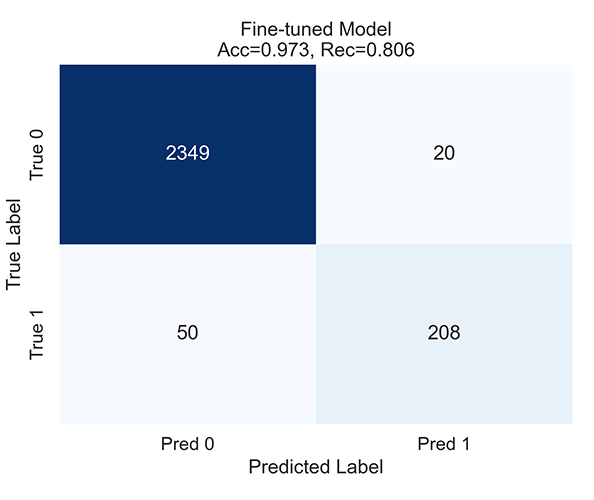
Model 1 - Confusion Matrix
Classification results showing true vs. predicted values
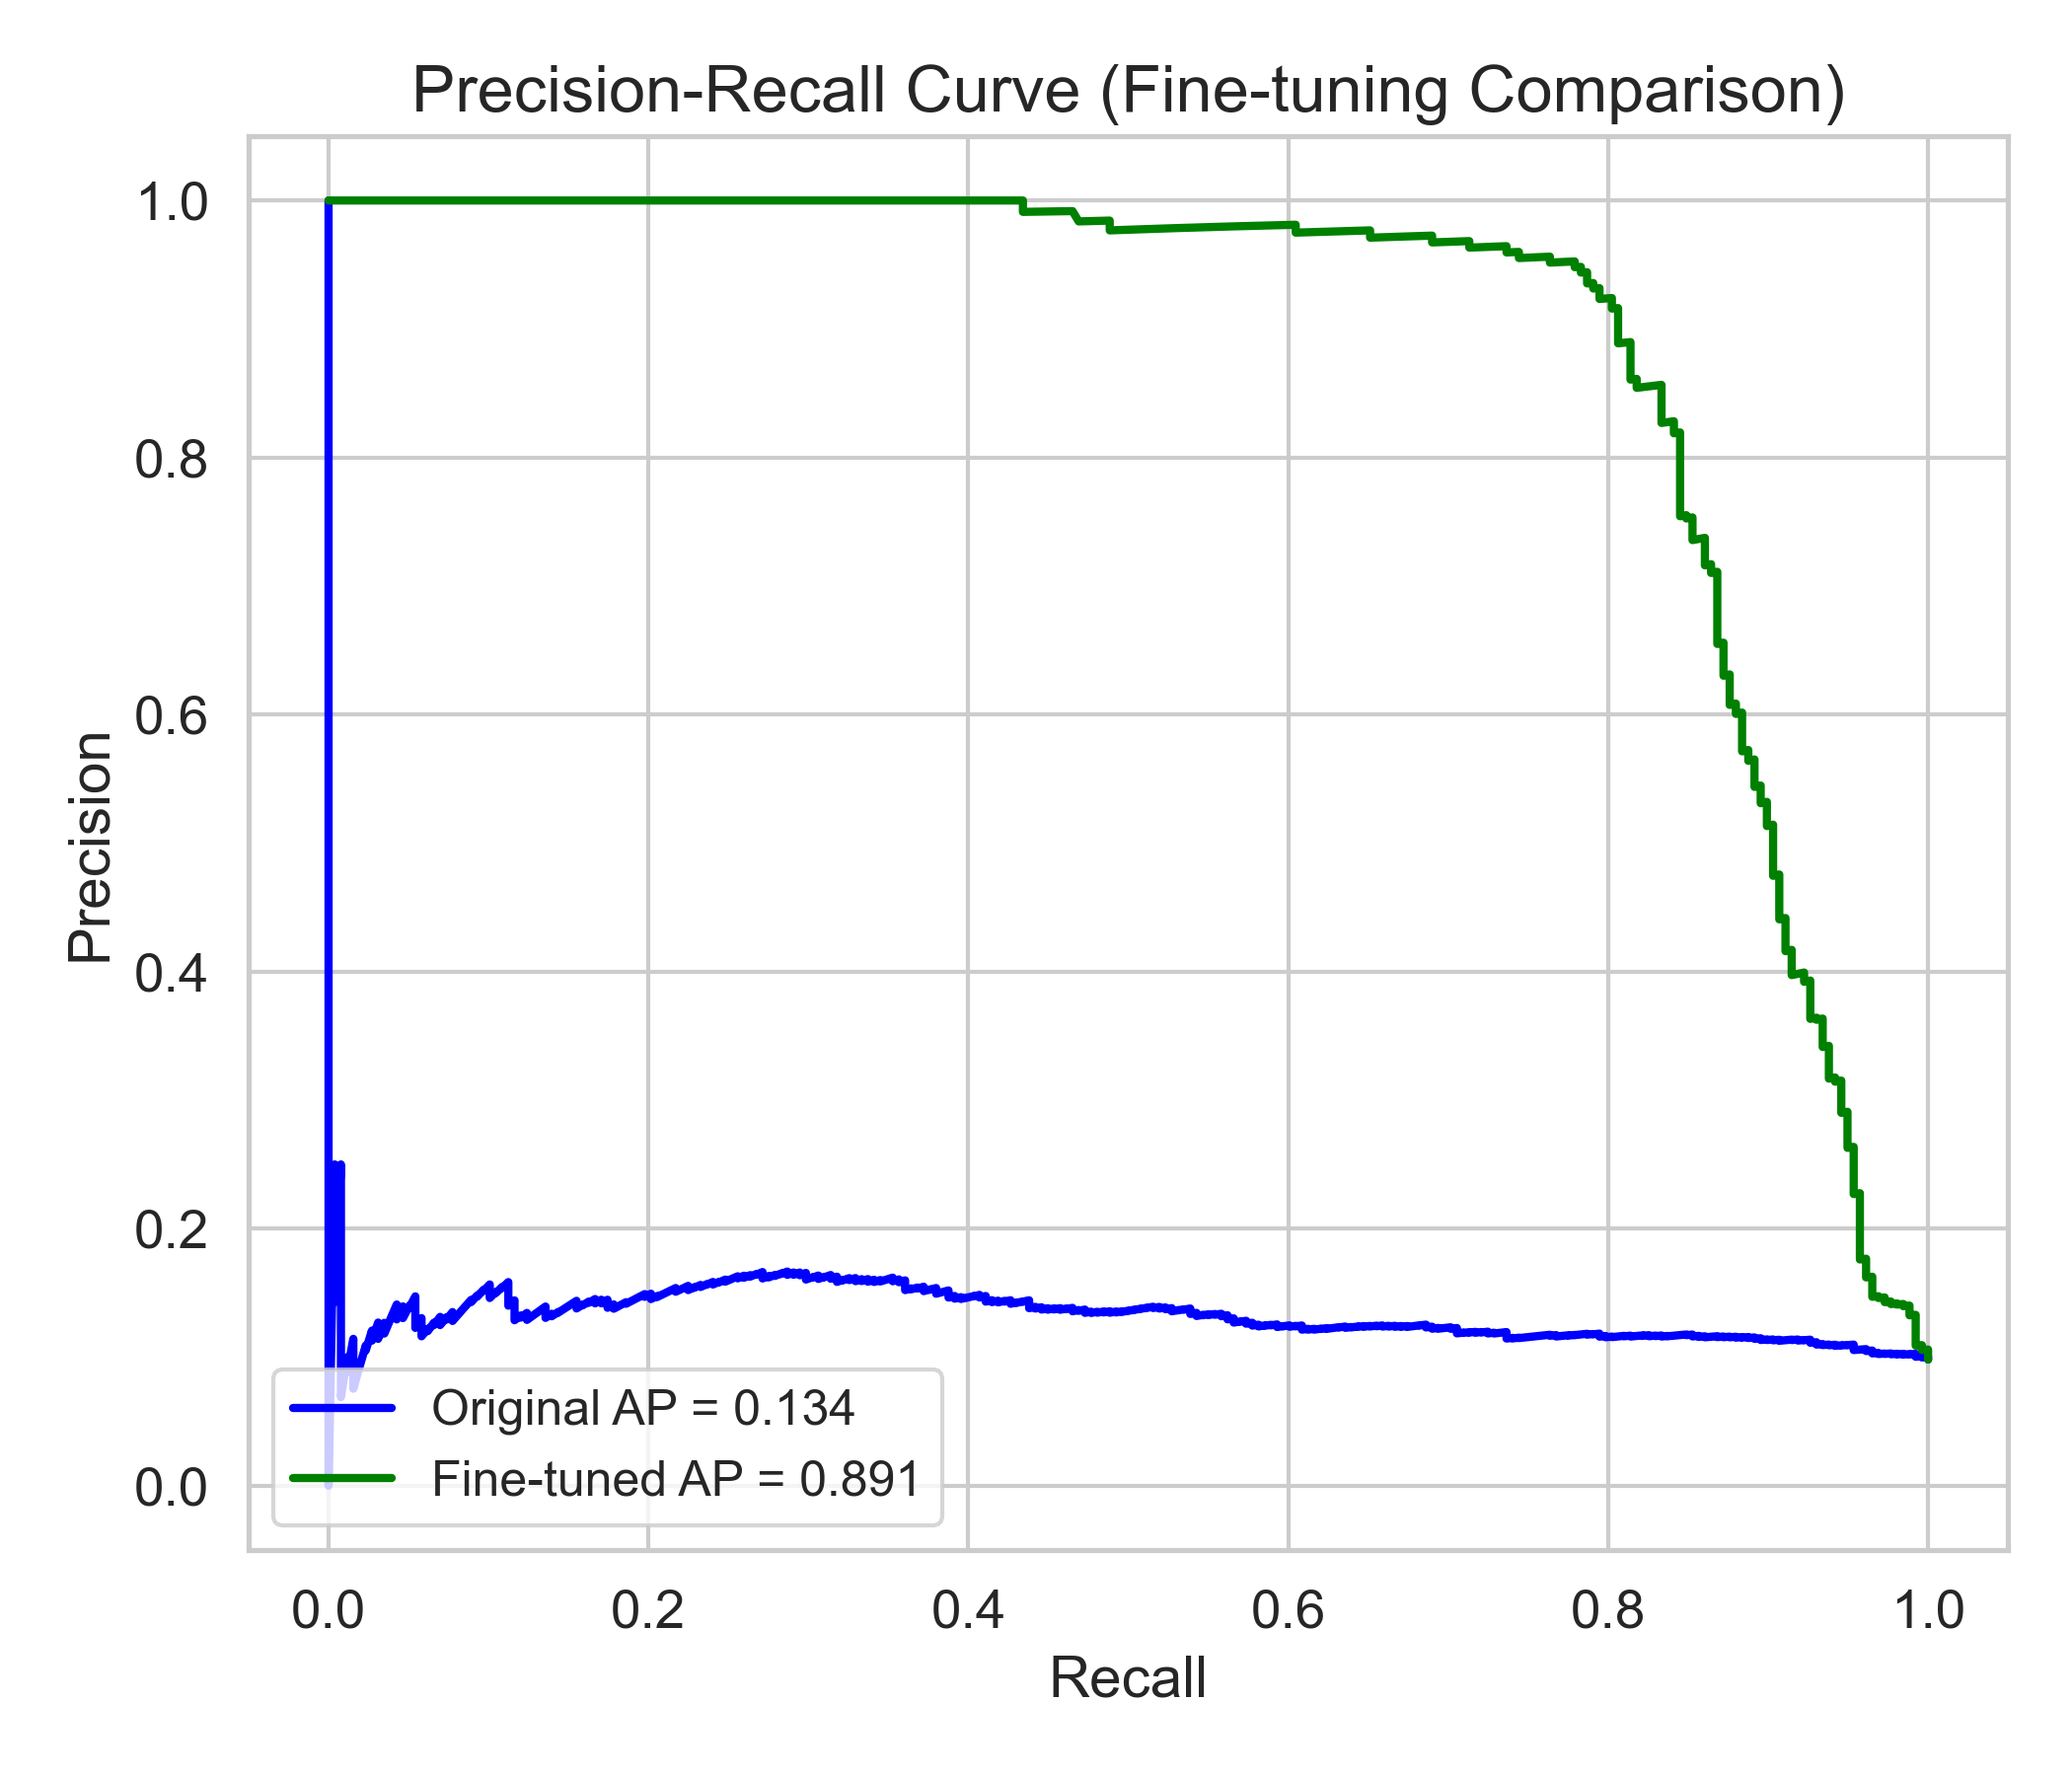
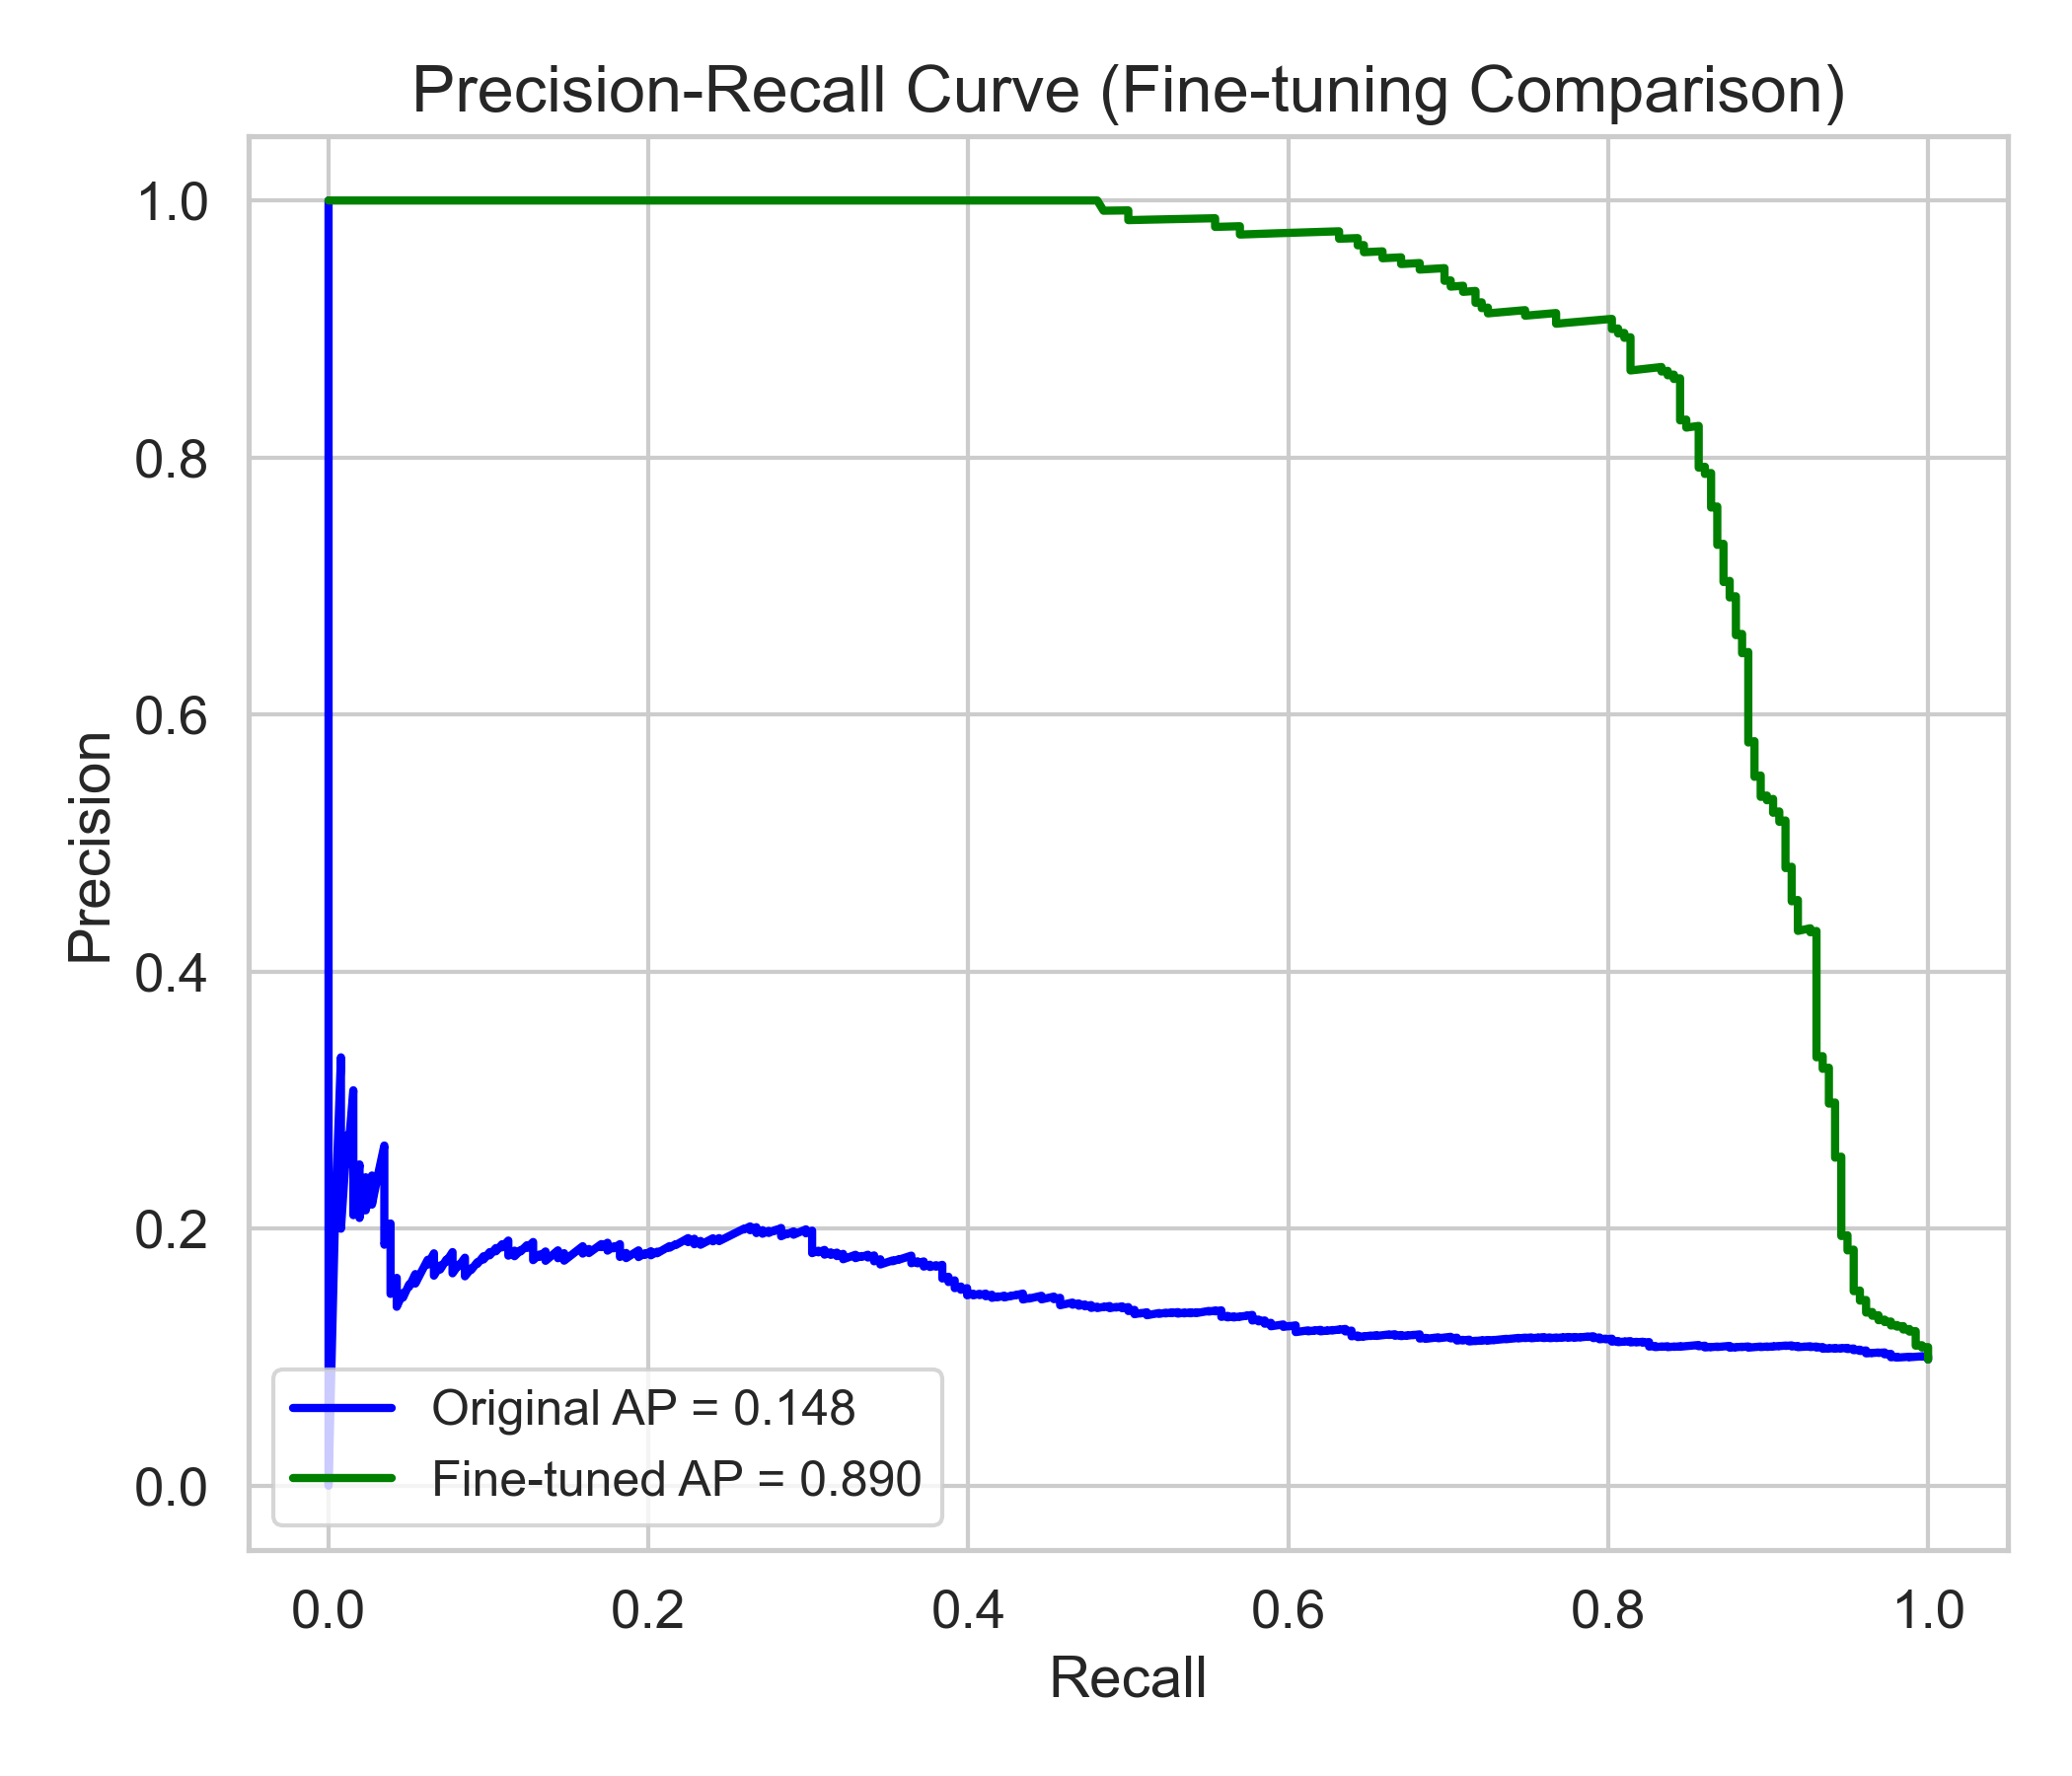
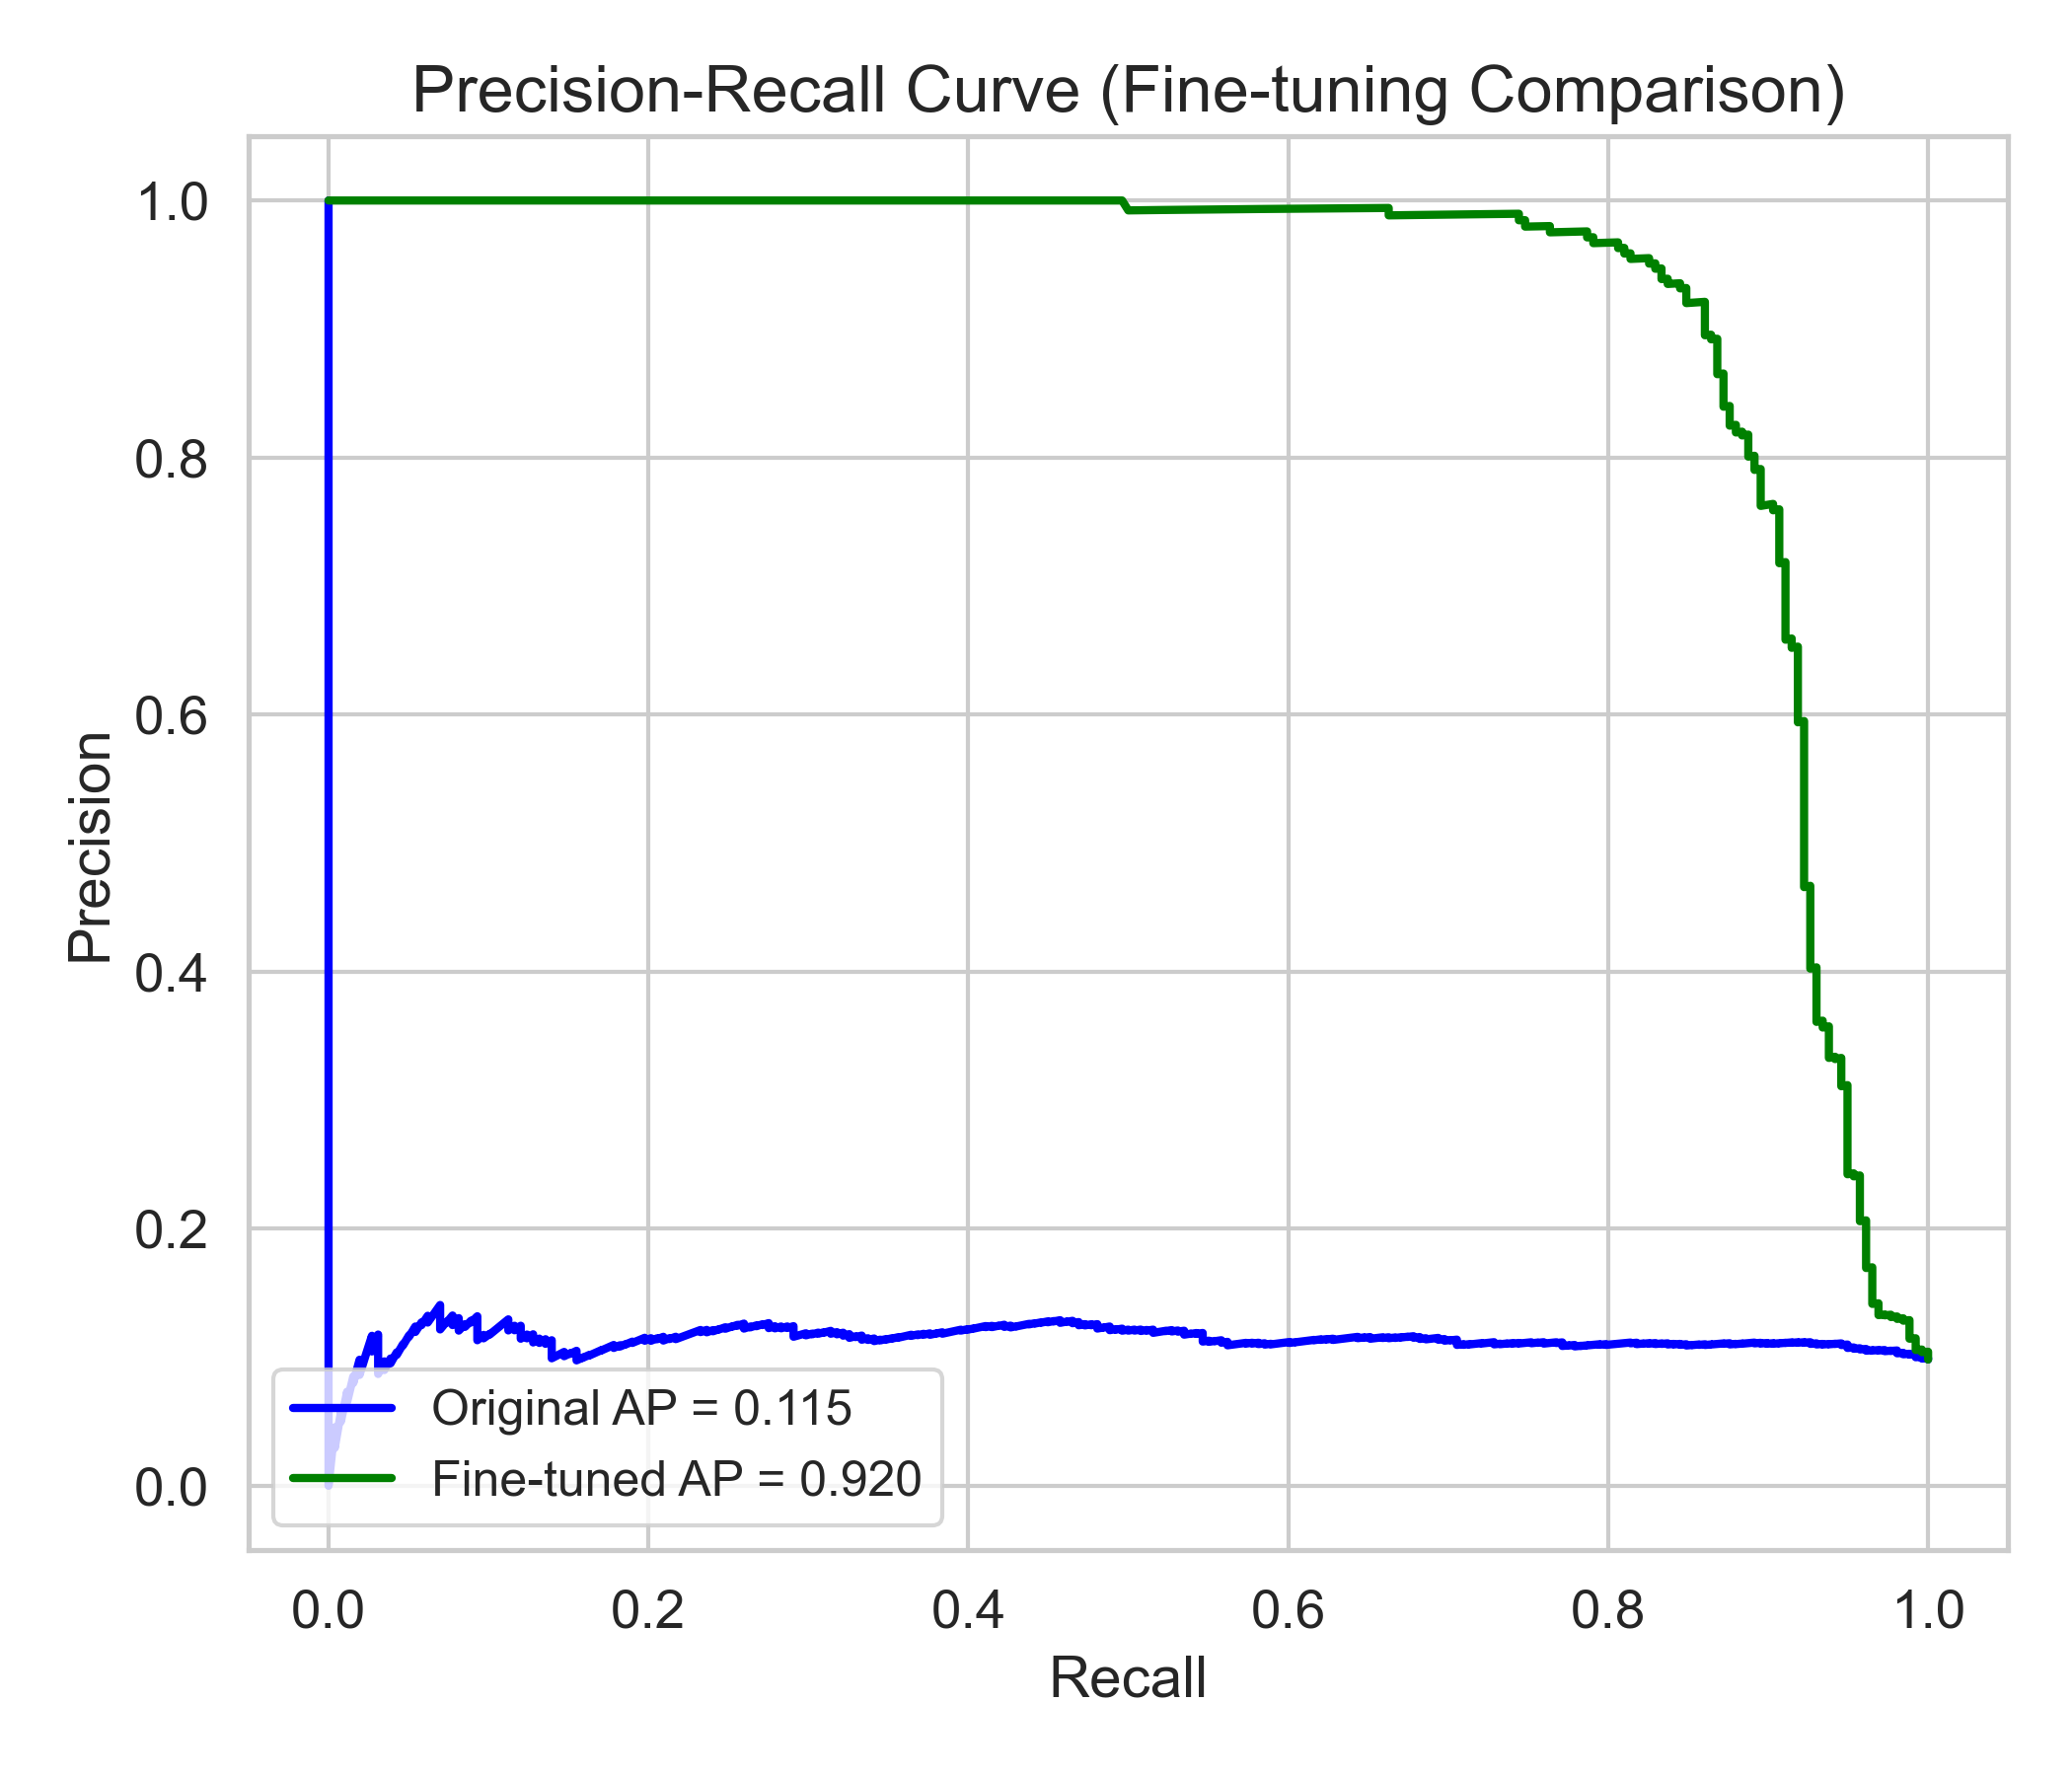
Model 1 - PR Curve
Relationship between precision and recall across different thresholds
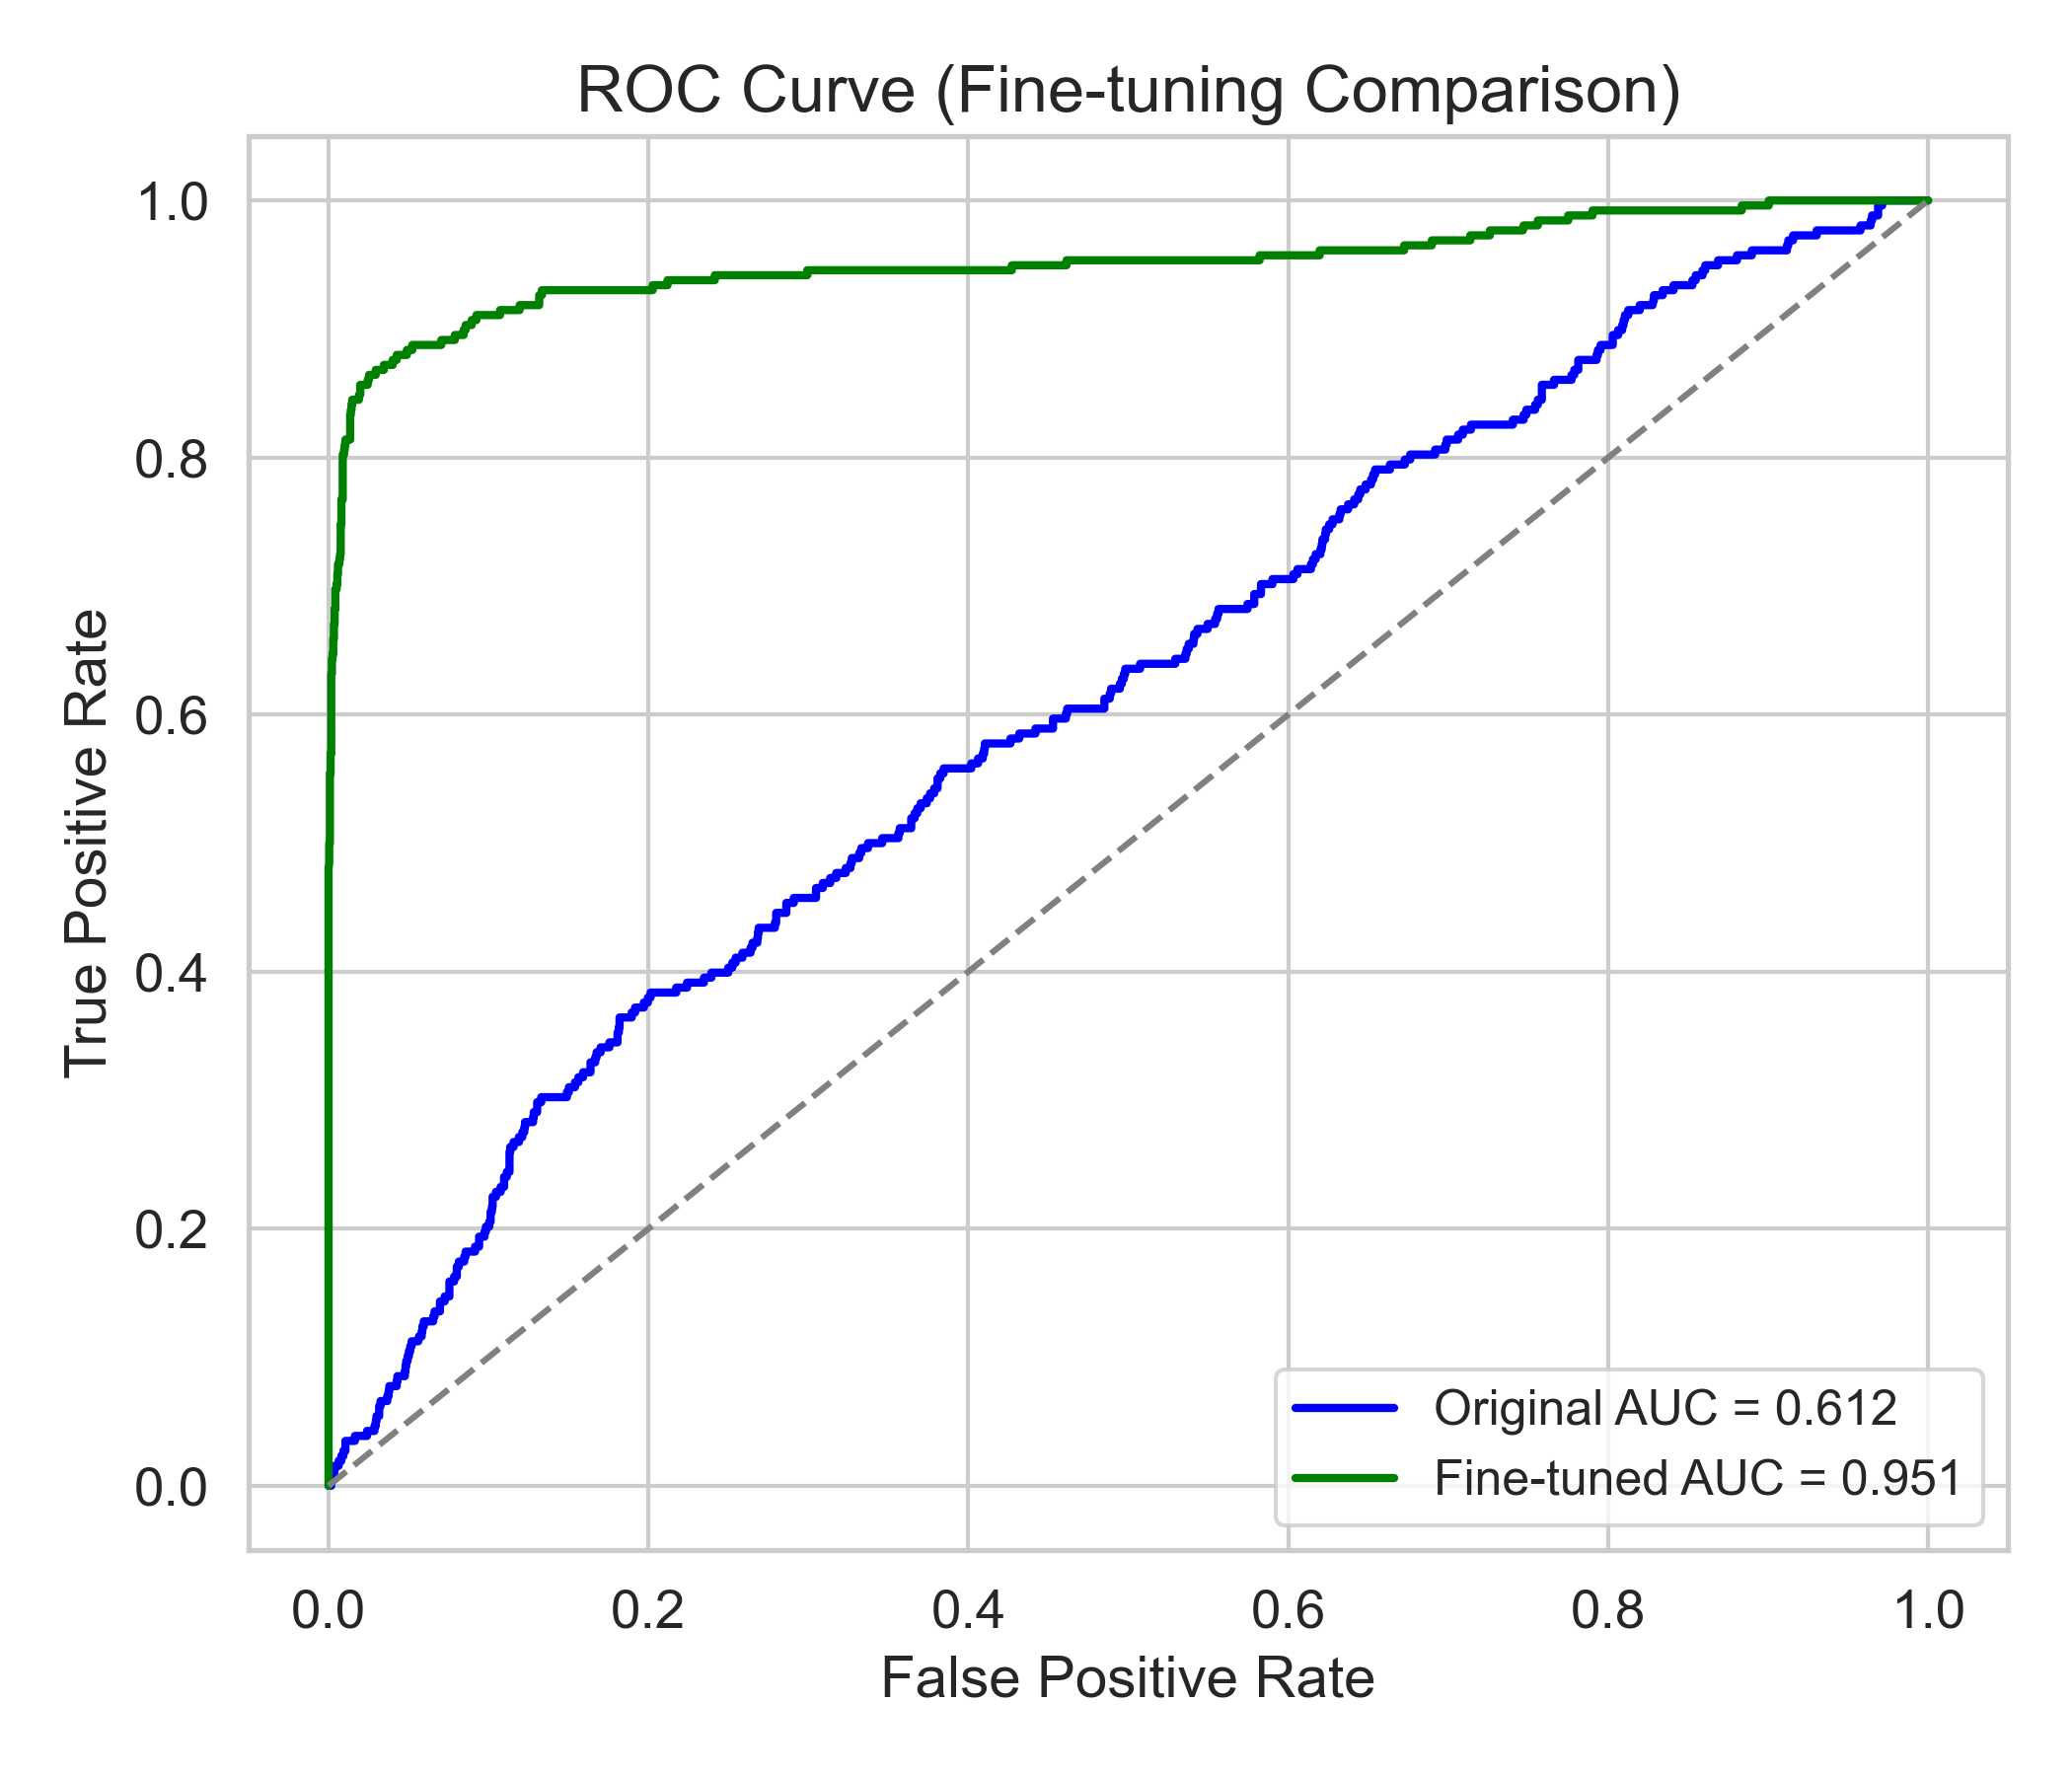
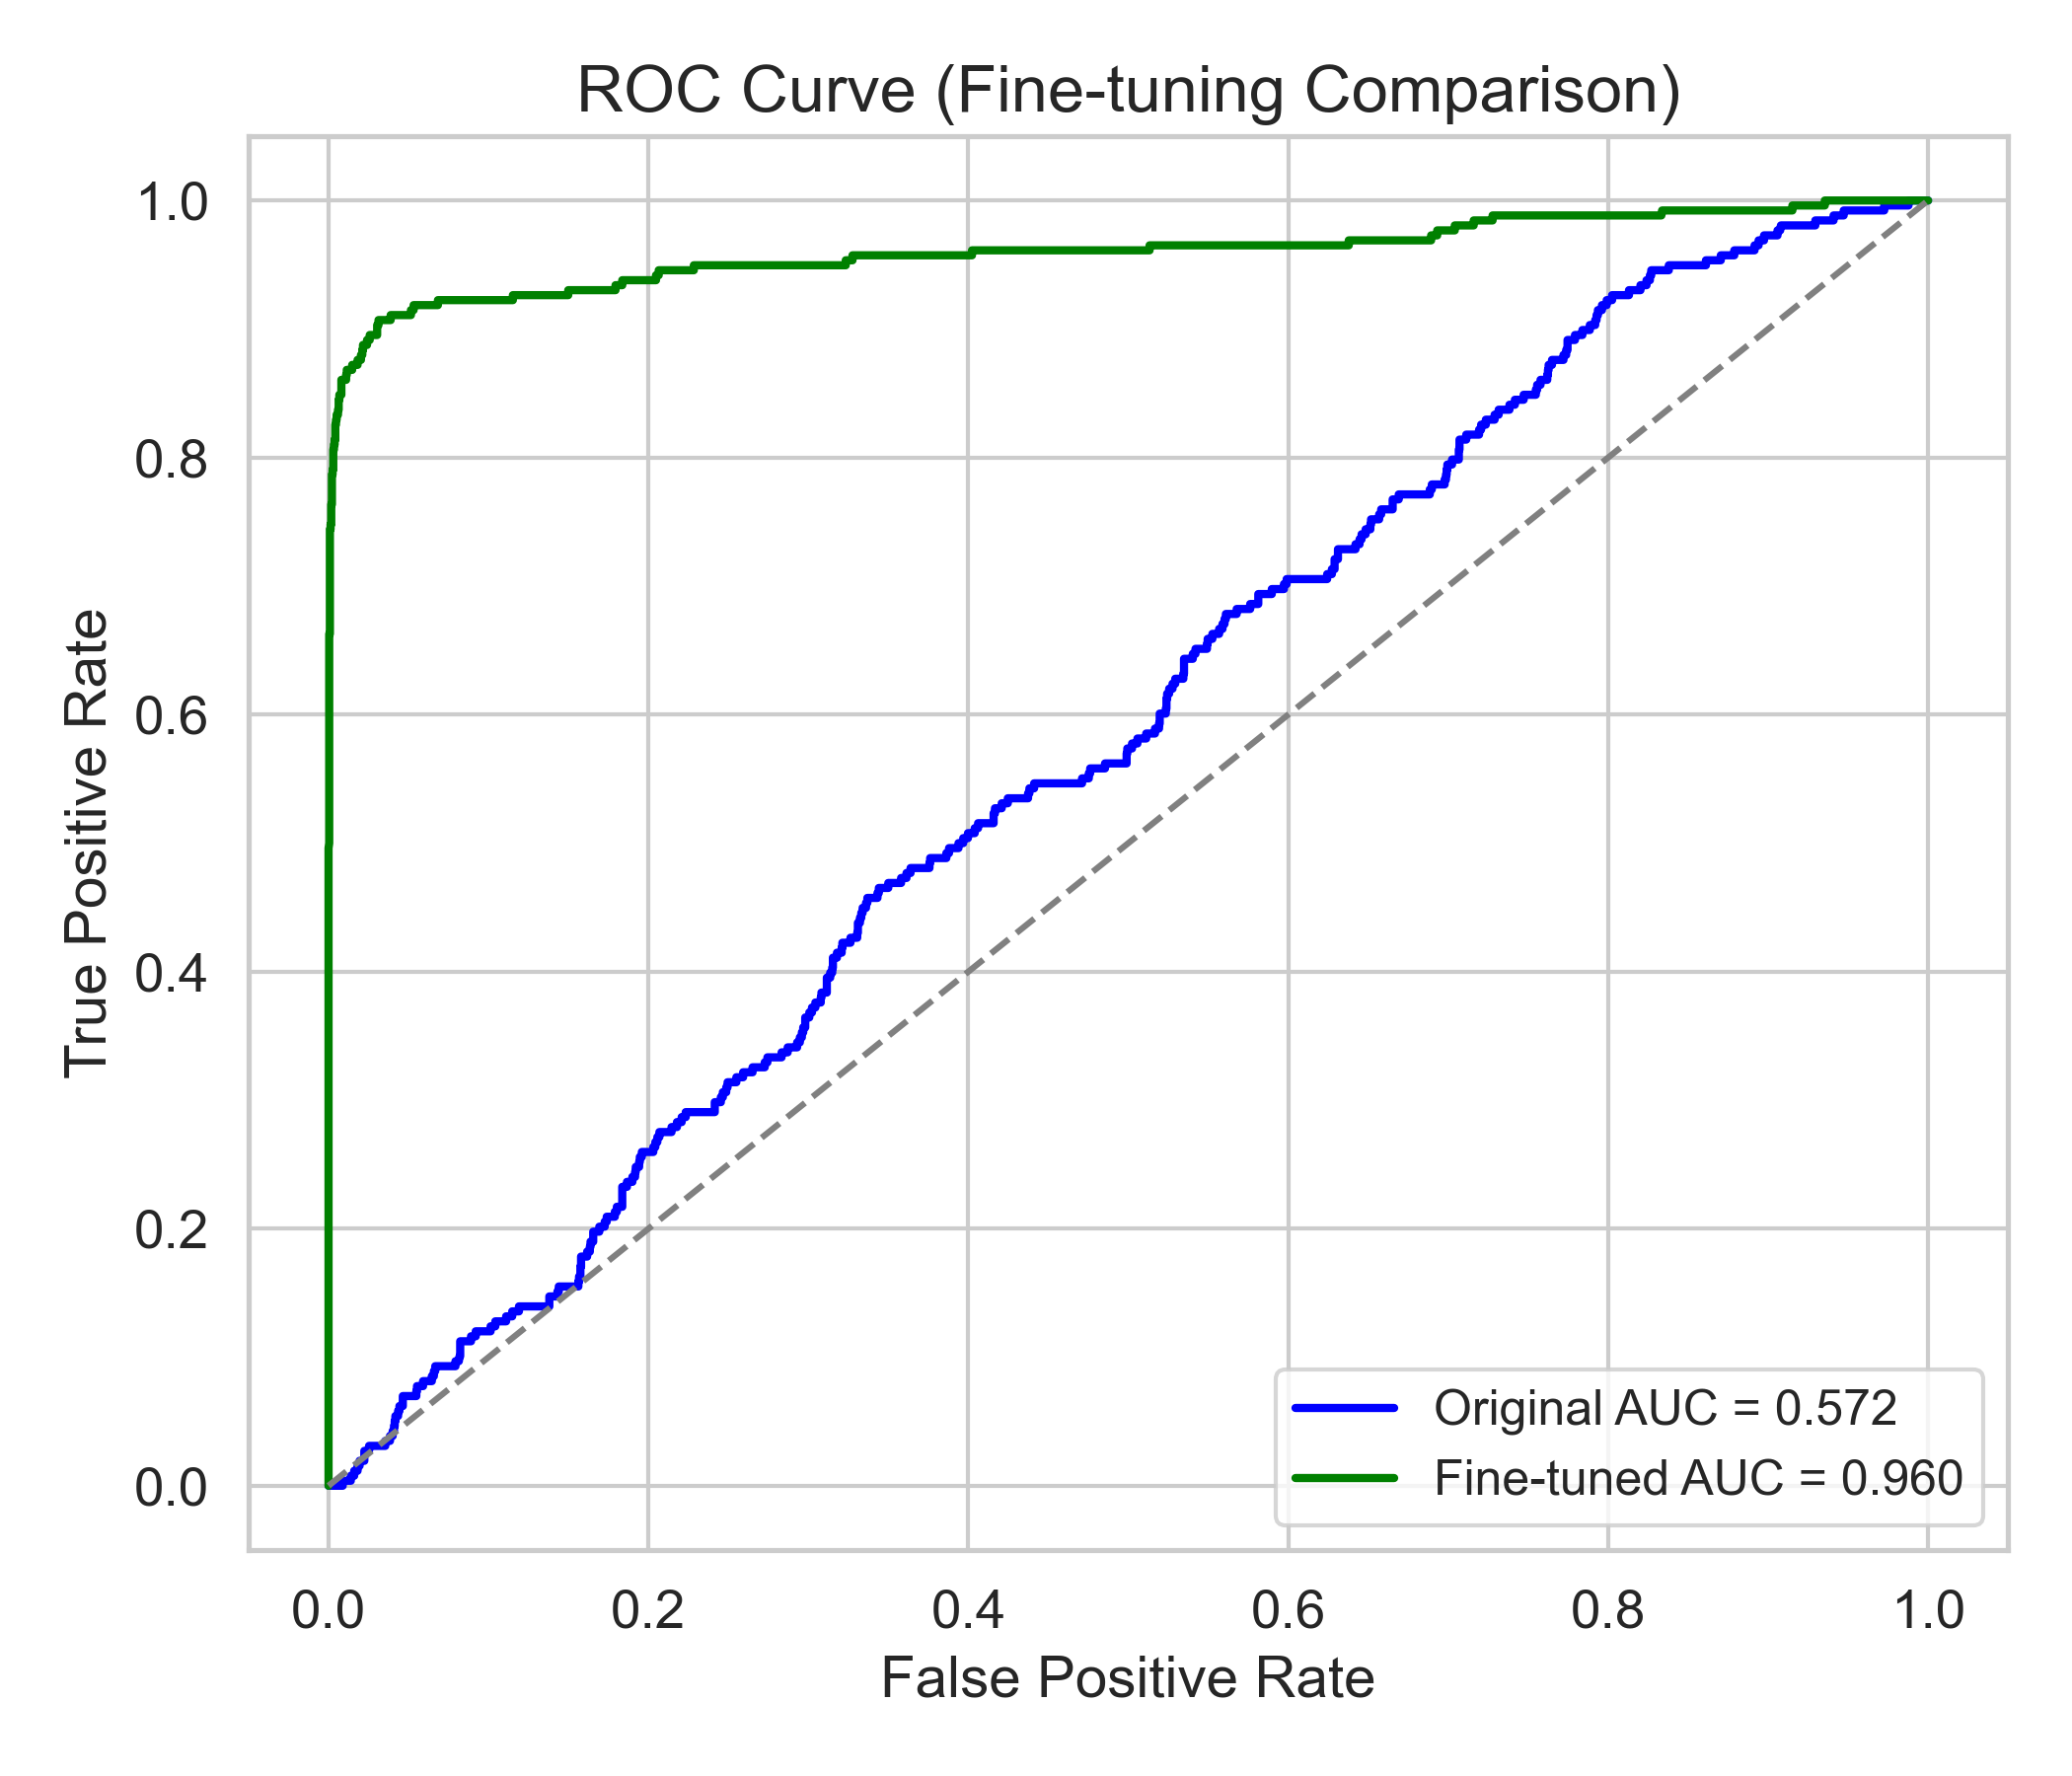
Model 3 - ROC Curve
Receiver Operating Characteristic curve showing true positive rate against false positive rate

Model 3 - Confusion Matrix
Classification results showing true vs. predicted values
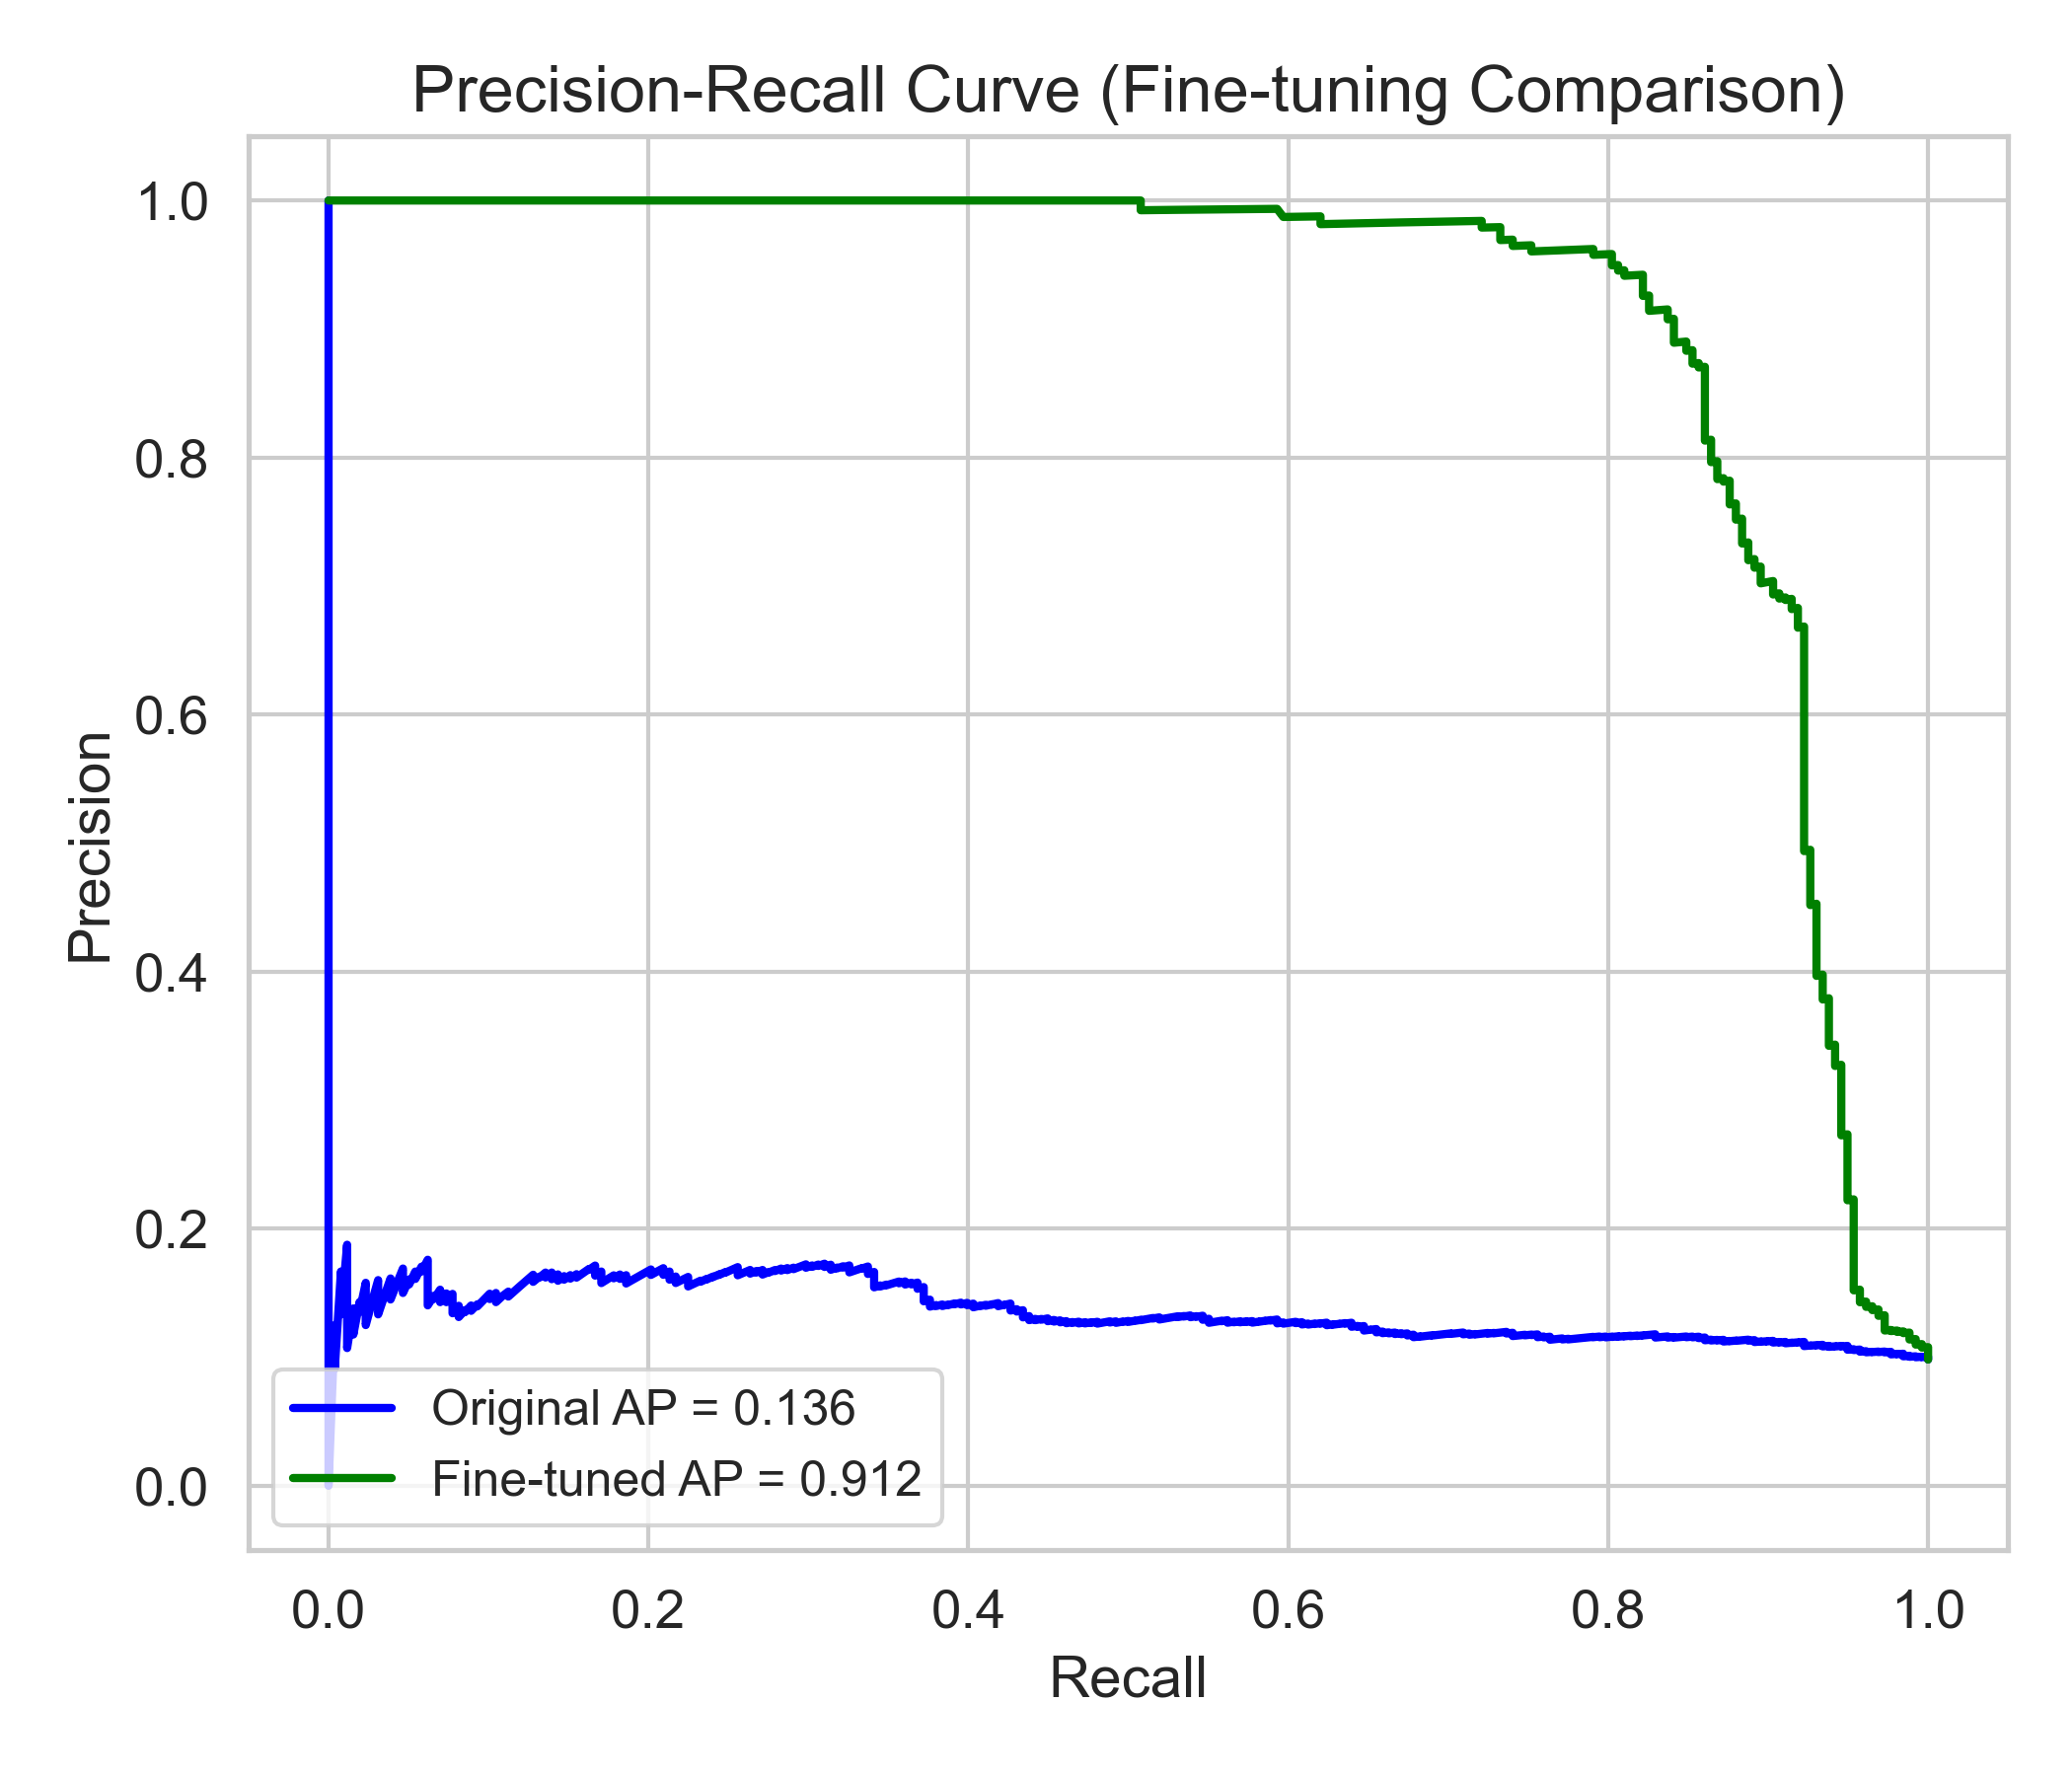
Model 3 - PR Curve
Relationship between precision and recall across different thresholds
Model 7 - ROC Curve
Receiver Operating Characteristic curve showing true positive rate against false positive rate

Model 7 - Confusion Matrix
Classification results showing true vs. predicted values
Model 7 - PR Curve
Relationship between precision and recall across different thresholds
Model 10 - ROC Curve
Receiver Operating Characteristic curve showing true positive rate against false positive rate

Model 10 - Confusion Matrix
Classification results showing true vs. predicted values
Model 10 - PR Curve
Relationship between precision and recall across different thresholds
Contact Us
Have questions, feedback, or need help? Our team is here to help.